Fast and furious An analysis
of fatal crashes involving speed and aggressive driving
On February 17, 2020, three teenagers were killed near Dallas, Texas when an 18-year-old driver lost control of his vehicle at high speed and struck two trees. The impact was so severe, it split the car in half before catching on fire. The single-car crash occurred around 3:45 a.m.
In August 2019, a man in Plattsmouth, Nebraska was sentenced to prison, after his road rage and aggressive driving caused the death of a motorcycle driver.
Despite significant advancements in motor vehicle safety, speed and aggressive driving remain significant factors in traffic fatalities in the United States.
After examining the most recent year of NHTSA fatal crash data, we found that over 25 percent of U.S. fatal crashes involved unsafe speed or aggressive driving. This amounts to 8,567 fatal crashes and 9,519 deaths directly attributed to those behaviors.
When and where do speed and road rage present the biggest problems? Who is most likely to be driving in crashes involving these factors? We further analyze the data below.
.embed-container { position: relative; padding-bottom: 80.25%; height: 0; overflow: hidden; max-width: 100%; } .embed-container iframe, .embed-container object, .embed-container embed { position: absolute; top: 0; left: 0; width: 100%; height: 100%; }
States with the highest and
lowest rates of fatal crashes
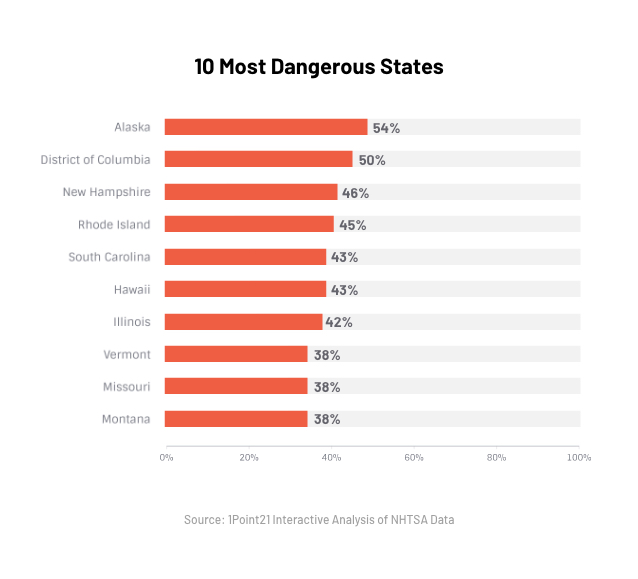
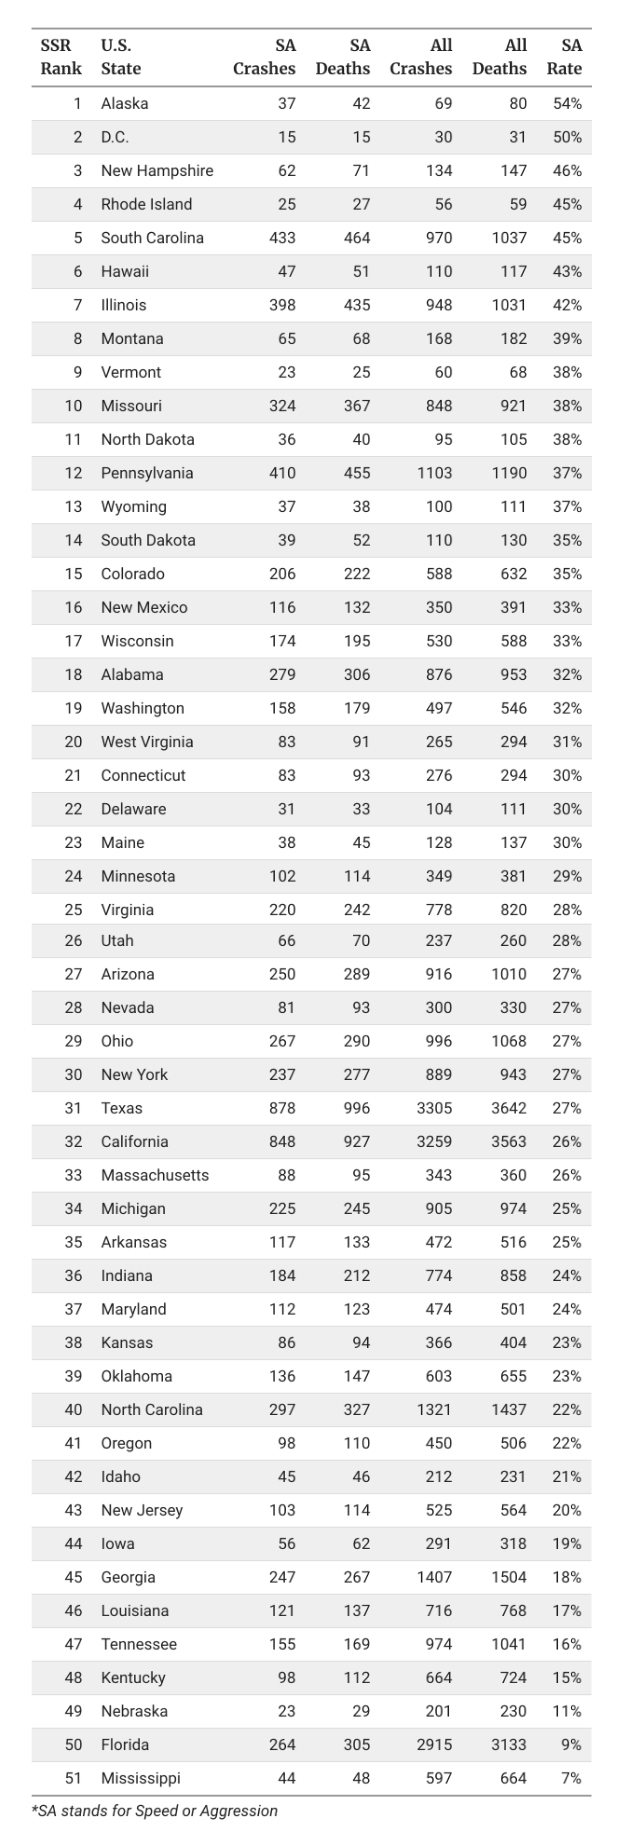
Texas (878) and California (848) had, by far, the most fatal crashes involving unsafe speed and aggressive driving. However, raw crash totals don’t exactly tell the whole story. When looking at crashes involving these behaviors as a percentage of total fatal crashes, we get a much better sense of where they are more or less prevalent. Through this lens, speed and aggression affect motorists in Alaska (54 percent), the District of Columbia (50 percent), and New Hampshire (46 percent) the most. In total, 32 states and the District of Columbia have rates higher than the national average of 25 percent.
The ten states with the highest rates are:
- Alaska: 54 percent
- District of Columbia: 50 percent
- New Hampshire: 46 percent
- Rhode Island: 45 percent
- South Carolina: 43 percent
- Hawaii: 43 percent
- Illinois: 42 percent
- Vermont: 38 percent
- Missouri: 38 percent
- Montana: 38 percent
Interestingly, South Carolina was the only state to rank in the top five for both crash count and percentage of all collisions.
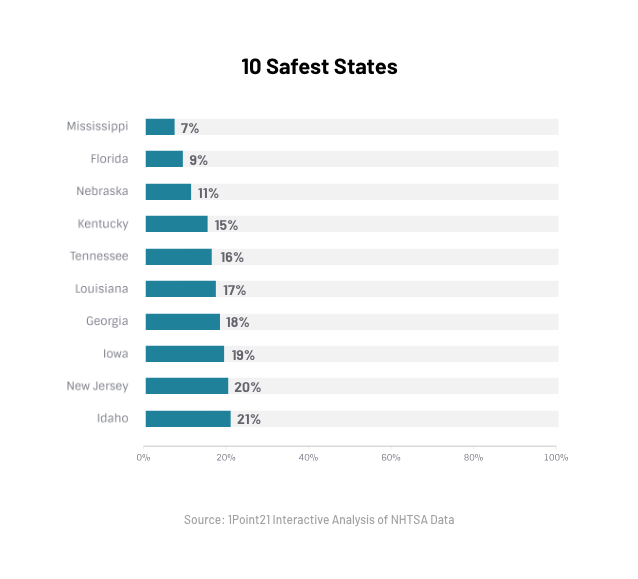
While Alaska had the highest rate, Mississippi had the lowest rate of speed and aggressive driving-related crashes at seven percent. Only 44 of the 597 fatal crashes in the Magnolia State were reported to involve a speeding or aggressive driver.
The states with the lowest rates are:
- Mississippi: 7 percent
- Florida: 9 percent
- Nebraska: 11 percent
- Kentucky: 15 percent
- Tennessee: 16 percent
- Louisiana: 17 percent
- Georgia: 18 percent
- Iowa: 19 percent
- New Jersey: 20 percent
- Idaho: 21 percent
Where Are Speeding and Road
Rage the Biggest Problems?
Fatal Crashes Involving Speed and Aggressive Driving as a Percentage of All Fatal Crashes
*In the table above SA stands for speed and aggression. This field includes any fatal crashes where at least one driver was noted to be speeding or driving aggressively.
U.S. States Ranked by Rate of Fatal
Crashes involving Speed or Aggression
Hustle and Bustle of the City
Nearly half of these crashes (4207) occurred in unincorporated county areas outside of the jurisdiction of any city. However, when crashes did occur within city limits, they most often happened in the following cities:
- Los Angeles: 86
- Dallas, TX: 66
- Chicago, IL: 59
- Phoenix, AZ: 42
- Charlotte, NC: 38
- San Antonio, TX: 34
- Milwaukee, WI: 33
- Middle Village, NY: 32
- Detroit, MI: 31
- Fort Worth, TX: 31
Of cities where at least 10 fatal speeding or road rage related crashes occurred, Baltimore, Maryland appears to have the biggest problem. A total of 18 such crashes occurred in Baltimore, amounting to 64 percent of all fatal crashes in the city. Kansas City and Milwaukee were tied for second and third with 62 percent.
- Baltimore, MD: 64 percent
- Kansas City, MO/KS: 62 percent
- Milwaukee, WI: 62 percent
- Long Beach, CA: 53 percent
- Hartford, CT: 52 percent
- Washington, D.C.: 50 percent
- Chicago, IL: 49 percent
- Anchorage, AL: 48 percent
- Aurora, CO: 47 percent
- Cleveland, OH: 44 percent
Despite having the seventh most total fatal crashes, Jacksonville, Florida had the lowest rate of speeding and road rage crashes at nine percent.
Speed and Make and Model
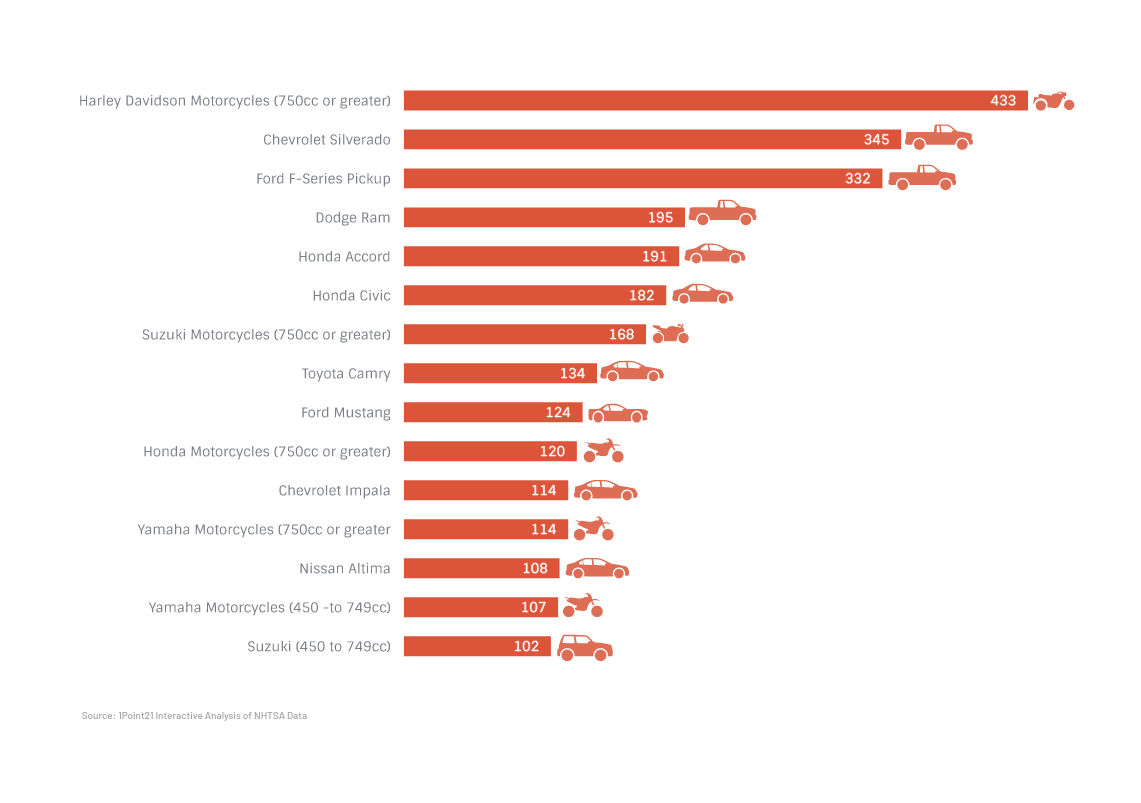
Do drivers involved in speed-related crashes drive certain cars? It turns out, there is a good chance they don’t drive cars at all. Of the 15 vehicles most often involved in these types of crashes, five were motorcycles and were pickup trucks. In fact, only one of the top five was a passenger vehicle – the Honda Accord at number five. Data shows that the following cars tend to speed the most:
Top 15 Vehicles Driven by Speeders in Fatal Crashes
Street Racing
We also examined crashes where police reports indicated that road racing was involved. While only 1.4 percent of the speed-related total, there were 116 crashes involving racing. These crashes claimed the lives of 153 people. This is especially interesting as there has been very little research or record-keeping on street racing, which some have estimated to claim the lives of around 50 people annually. The fact that 2018 shows over three times that number may warrant further study.
15 states recorded three or more fatal crashes involving crashing:
- California: 18
- Texas: 14
- Illinois: 8
- North Carolina: 7
- South Carolina: 6
- Virginia: 6
- Washington: 5
- Arizona: 4
- Pennsylvania: 4
- Florida: 3
- Georgia: 3
- Iowa: 3
- Kansas: 3
- Michigan: 3
- Missouri: 3
Road Rage and Aggressive Driving
In 2018, road rage and aggressive driving were factors in 402 fatal crashes, killing 473 people.
The NHTSA defines aggressive driving as “the operation of a motor vehicle in a manner that endangers or is likely to endanger persons or property.” In this data, aggressive driving behaviors can include following too closely, changing lanes without caution or signal, running a red light, improper passing, and road rage.
Only nine states reported more than 10 fatal crashes involving these behaviors:
- Indiana: 75
- Alabama: 67
- Colorado: 57
- South Carolina: 57
- Wisconsin: 41
- Connecticut: 20
- Arkansas: 11
- Texas: 11
- New York: 10
When Do Speed Related Crashes Occur?
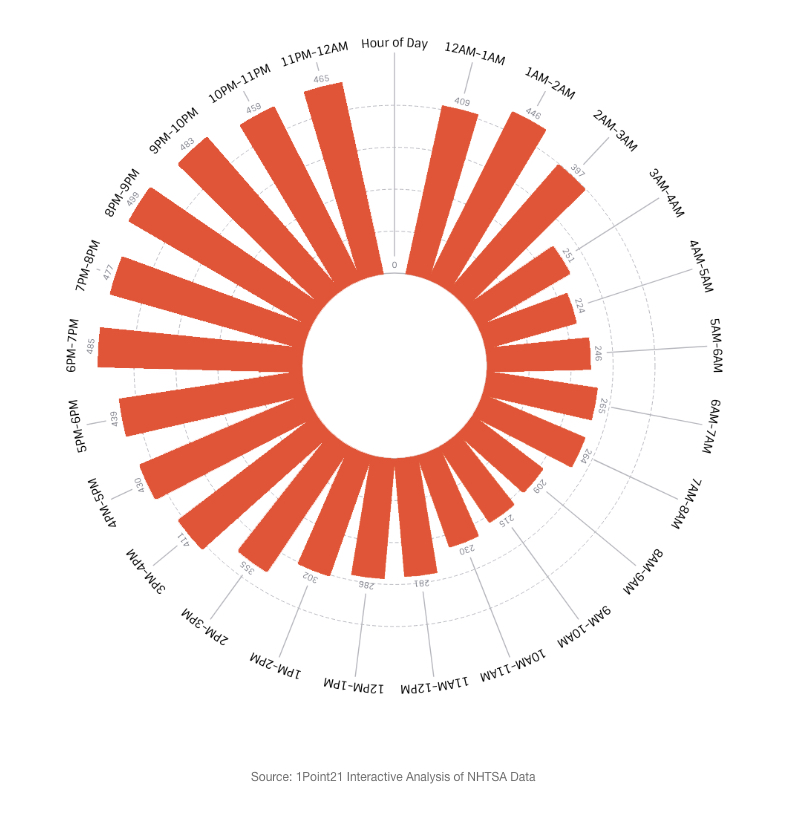
In 2018, speed and road rage related fatal crashes occurred the most over the weekend: Saturday (1,637) and Sunday (1,532), followed by Friday (1,272). Overall, people drive more cautiously during the workweek, with Tuesday (988) marking the safest day on the road and Saturday the least.
While fatal crashes involving these behaviors peaked at midnight and at 3 a.m., the four-hour block between 6 p.m. and 10 p.m. were the four deadliest hours across all days. This block seems to fit in with the evening rush hour period, where traffic volume – and driver frustration – is likely at its peak across the country.
Total fatalities reported across all days in 2018 during 6:00 p.m. to 10 p.m.:
6:00 p.m.: 547
7:00 p.m.: 522
8:00 p.m.: 550
9:00 p.m.: 538
10:00 p.m.: 515
This compares to the safest hours, which were 4 a.m. to 10 a.m.
When do Speed Related Crashes Happen?
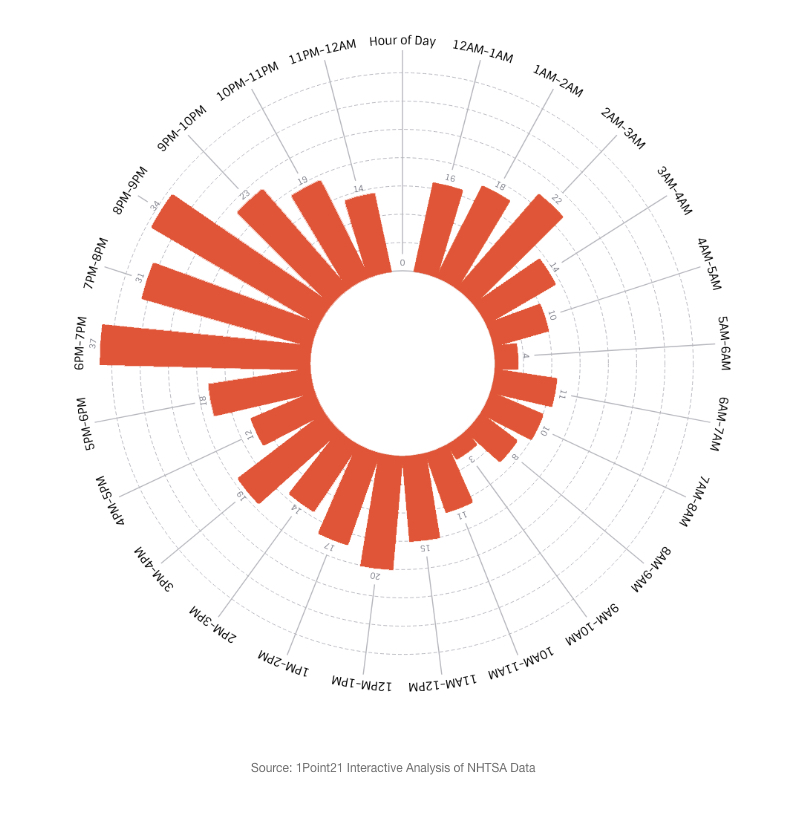
When is the Angriest Time of Day?
Fatal crashes involving road rage by hour
Who is Driving when Speed or
Road Rage Kills?
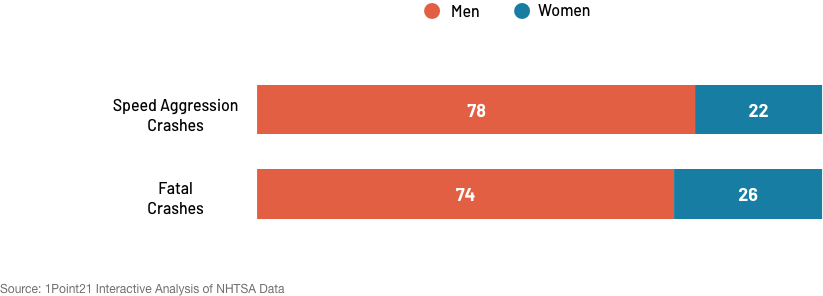
Overall, male drivers are much more likely to be in a fatal crash than female drivers are. In speed and aggression-related crashes, however, the disparity is even greater. 78 percent of drivers involved in such crashes were male, while just 22 percent were female.
This compares to 74 percent and 26 percent for all fatal crashes, respectively.
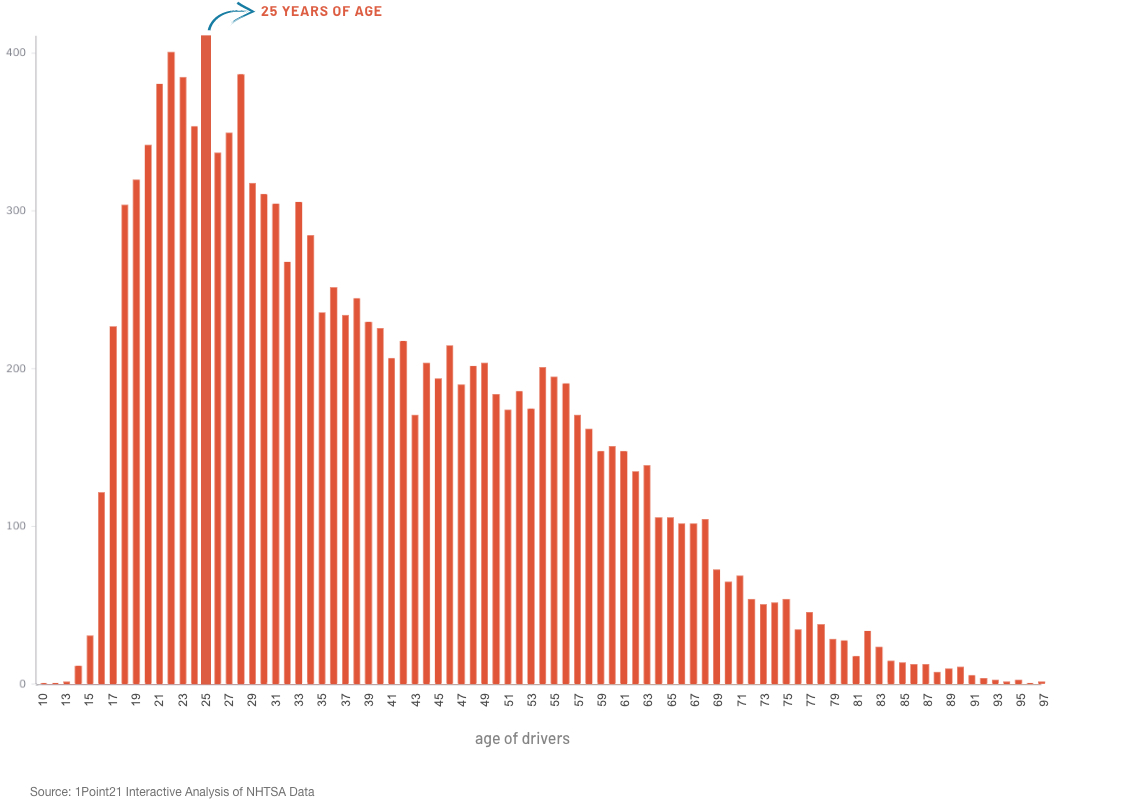
It is no secret that younger drivers (particularly younger male drivers) have a particular affinity for speed and risk-taking. Countless studies have proven this point over the years. That trend holds true in our analysis as well. 15 percent of drivers involved were between the ages of 20 and 24 – the highest of any age group – despite making up only 8 percent of the license eligible population.
Age of Speeding or Aggressive
Drivers in Fatal Crashes
How this Data Can Help?
People speed or drive aggressively for a number of reasons, but intending to hurt or kill someone is rarely among them. The purpose of this data analysis is to provide context to and illuminate the consequences of those driving behaviors. We hope that in reading it, drivers evaluate their driving habits and reconsider when engaging in one of the examined behaviors. Whether you are running late or overcome with emotion, the consequences of a speeding and road rage fatal crash are irreversible.
Tips to help you prevent aggressive driving or speeding:
– Make it a habit to leave 10 to 15 minutes earlier, no matter where you are headed
– Plan ahead by mapping your route before getting in the car
– If possible, leave before or after heavy traffic times
– Listen to music, an audiobook, or podcast that you find calming and relaxing
– Respect other drivers on the road by signaling when you switch lanes, using the left lane as a passing lane on the highway, and not tailgating.
– Practice safe and defensive driving by giving the road your full and undivided attention.
Tips for when you encounter others speeding or driving aggressively:
01. Avoid engaging with the aggressive driver
The driver may try to bait you with profanity or insults, but you don’t need to waste your energy or time by responding. Responding will likely make the situation worse.
02. Don’t take it personally
Remember the other driver’s behavior has nothing to do with you.
03. Leave the situation
As soon as you notice a driver threatening you or making you feel uncomfortable, look for the first exit. Don’t wait for it to get worse; your safety comes first.
04. Find your calm
If you are losing your cool, pull over to a parking lot and take a moment for yourself, or sing along to your favorite Christmas playlist. Take the time you need to recover before returning to the road.
Methodology & Fair Use
Using fatal crash data from the National Highway Traffic Safety Administration (NHTSA) for 2018 (the most recent available data), we isolated all fatal crashes where at least one driver was reported to be speeding or driving aggressively. According to the NHTSA, speeding falls into three general categories: one or more drivers was street racing, exceeding the speed limit or driving too fast for road, traffic or atmospheric conditions.
- 01. Racing
- 02. Exceeding the speed limit
- 03. Driving to fast for conditions
If you would like to republish this analysis or any data, image or interactive element within, please provide credit by linking to this page.